Your Pipeline Is 10.5h Behind: Catching Space Sentiment Leads with Pulsebit
Just yesterday, we observed a striking anomaly in the sentiment data: a 24h momentum spike of +0.217. This spike is particularly notable as it highlights a surge in discussions around a fascinating topic—specifically, the sea-urchin robot named Argus, which has captured the attention of Spanish press outlets ahead of its English counterparts. In fact, the leading language for this spike is Spanish, with a 10.5-hour lead over Dutch reporting. If your pipeline isn't equipped to handle multilingual nuances or entity dominance, you may have missed this significant shift.
Spanish coverage led by 10.5 hours. Nl at T+10.5h. Confidence scores: Spanish 0.85, English 0.85, French 0.85 Source: Pulsebit /sentiment_by_lang.
This scenario underscores a critical gap in many pipelines that don't prioritize multilingual origin or the dominance of certain entities in the narrative. If your model isn't designed to account for these factors, you might find yourself 10.5 hours behind the curve. The Spanish press is leading with this story, while other languages lag behind. Missing out on these nuances can mean losing valuable insights and missing critical sentiment shifts in real-time.
Now, let’s dive into the code that can help you catch these sentiment leads before they slip away. We’ll start by filtering for the Spanish language using our API, and then we’ll perform a sentiment analysis on the narrative surrounding the emerging theme.
import requests
# Define parameters for the API call
topic = 'space'
score = +0.075
confidence = 0.85
momentum = +0.217
language_filter = "sp"
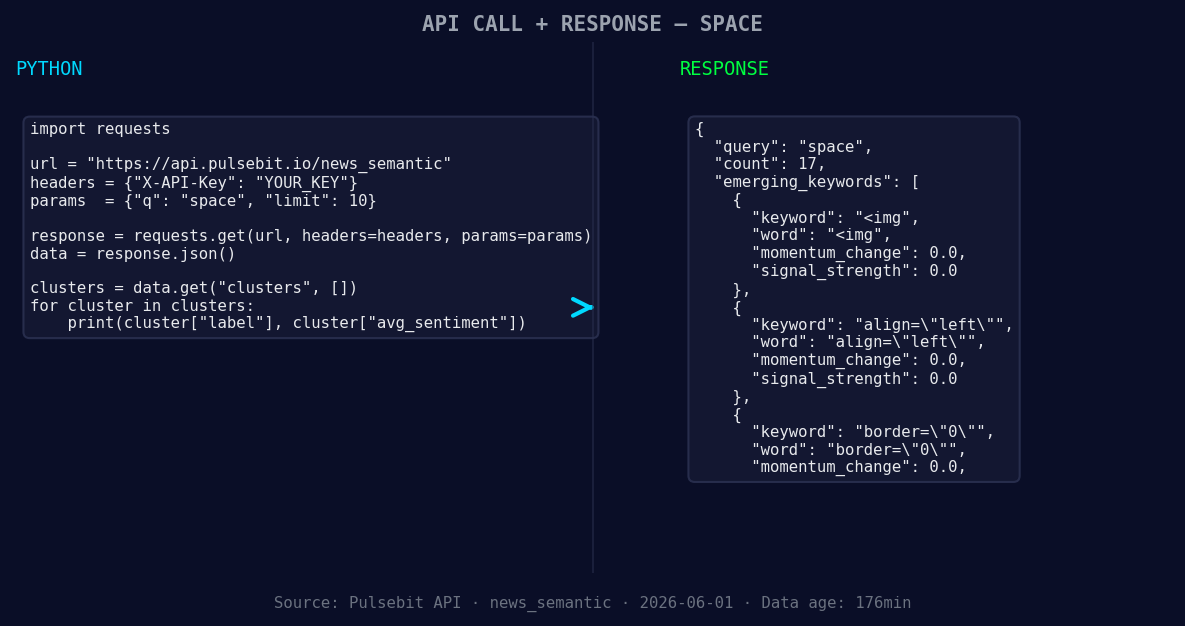
*Left: Python GET /news_semantic call for 'space'. Right: returned JSON response structure (clusters: 3). Source: Pulsebit /news_semantic.*
# API call to filter by language/country
url = "https://api.pulsebit.com/sentiment"
params = {
"topic": topic,
"lang": language_filter,
"momentum": momentum,
"confidence": confidence
}
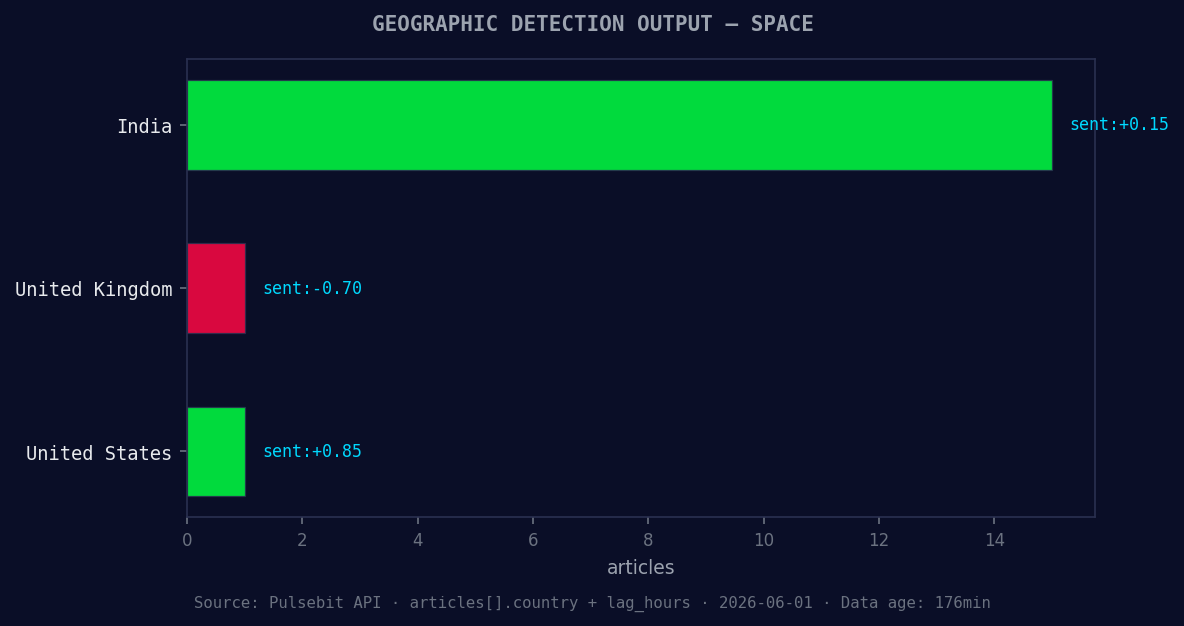
*Geographic detection output for space. India leads with 15 articles and sentiment +0.15. Source: Pulsebit /news_recent geographic fields.*
response = requests.get(url, params=params)
data = response.json()
print(data) # This will show you the relevant articles and sentiment scores
# Now, let's run the cluster reason string through the sentiment endpoint
cluster_reason = "Clustered by shared themes: robot, meet, argus:, sea-urchin, eyes."
sentiment_response = requests.post(url, json={"text": cluster_reason})
sentiment_data = sentiment_response.json()
print(sentiment_data) # This provides insight into the narrative framing
With this code snippet, you can filter out the sentiment related to space discussions originating from Spanish sources. The second part of the code runs the cluster reason string through the sentiment endpoint to score the narrative itself, revealing how the themes are being framed in discussions. This dual approach allows us to capture and evaluate the sentiment landscape effectively.
Here are three specific builds you could implement using this momentum spike pattern:
Geo-Filtered Alerts: Set up a system where you receive alerts for any momentum spikes in the Spanish language around the topic of 'space' with a threshold of momentum > +0.2. This ensures you’re always the first to know about emerging trends.
Meta-Sentiment Dashboard: Build a dashboard that visualizes sentiment scores for cluster narratives, specifically targeting themes like "robot," "meet," and "Argus." Use a threshold of sentiment score > +0.1 to highlight positively framed narratives.
Engagement Metrics for Emerging Themes: Track engagement metrics for articles clustering around the theme of 'Argus', using the sentiment scores as a gauge for public interest. Set a signal strength threshold of > 0.5 to determine which themes are gaining traction.
For a deeper dive into how to leverage these insights, check out our documentation at pulsebit.lojenterprise.com/docs. You can copy-paste and run these examples in under 10 minutes, putting you right on the cutting edge of sentiment analysis.