Here's a small C program. It calls clock_gettime() three times, then writes five bytes to standard output.
#include <stdio.h>
#include <time.h>
#include <unistd.h>

int main(void)
{
    struct timespec ts;

    for (int i = 0; i < 3; i++)
        clock_gettime(CLOCK_MONOTONIC, &ts);

    write(1, "done\n", 5);
    return 0;
}
Both of those look like system calls. Both of them ask the kernel for something your program can't get on its own: the current time, and access to a file descriptor.
Now run it under strace, which reports every system call a process makes:
gcc -O0 -o mystery mystery.c
strace ./mystery 2>&1 | grep -c clock_gettime
The answer is 0.
The write() shows up immediately. The three clock_gettime() calls don't appear at all. Same program, same libc, same machine, and one of them never reaches the kernel.
By the end of this article you'll know every step between your write() and the code that runs inside the kernel, why the return trip is stranger than the way in, and why clock_gettime() gets to skip the whole thing.
Table of Contents
What You Need
You need an x86-64 machine running Linux, gcc, strace, and objdump. On Debian or Ubuntu that's build-essential, strace, and binutils. You also need to be comfortable reading C. You don't need to have written kernel code, and you won't build or install a kernel here.
Everything below runs on a normal user account, except for one optional tracing step that needs sudo.
Two warnings about scope. First, this article is about x86-64 only. ARM64 does the same job with different instructions and different register rules, and hedging every sentence for both would double the length and halve the clarity. Second, kernel internals move. I ran everything here on Linux 5.15 (Ubuntu 22.04, Intel Core i7-10750H), and I'll flag the places where newer kernels differ. Check your own version with uname -r.
What a System Call Looks Like from Userspace
Let's start with a correction that matters: write() isn't a system call. It's an ordinary C function in your C library. That function makes a system call on your behalf, and the difference between those two things is where most confusion about the kernel begins.
You can prove it by cutting libc out and making the call yourself.
On x86-64, a system call has a fixed convention. You put the number of the call you want in rax, and its arguments in rdi, rsi, rdx, r10, r8, and r9, in that order. Then you execute a single instruction called syscall.
The numbers aren't something you memorise. They live in a header on your machine:
grep -E "__NR_(write|getpid|clock_gettime) " /usr/include/x86_64-linux-gnu/asm/unistd_64.h
On this machine:
#define __NR_write 1
#define __NR_getpid 39
#define __NR_clock_gettime 228
So write is call number 1. Here's that call written by hand, with no libc wrapper involved:
static long raw_write(int fd, const void *buf, unsigned long count)
{
    long ret;

    __asm__ volatile (
        "syscall"
        : "=a" (ret)                   /* the result comes back in rax */
        : "a" (1L),        /* rax = 1, the syscall number for write */
          "D" ((long)fd),  /* rdi = first argument                  */
          "S" (buf),       /* rsi = second argument                 */
          "d" (count)      /* rdx = third argument                  */
        : "rcx", "r11", "memory"
    );

    return ret;
}
Compile and run it and your bytes turn up on standard output, with nothing from libc anywhere in the path.
Look at that last line, the clobber list. It tells the compiler rcx and r11 are going to be destroyed. I didn't add that for safety. It's a fact about the hardware, and it quietly explains something odd about the convention above.
C functions on x86-64 pass their fourth argument in rcx. System calls pass theirs in r10 instead. Every explanation that says "because that's the convention" stops one step too early. The real reason is that the syscall instruction overwrites rcx as part of doing its job. The kernel couldn't receive a fourth argument there even if it wanted to, so the ABI routed around its own hardware.
This is the first sign that this boundary isn't a function call wearing a costume. Different mechanism, different rules, and the hardware got there first.
You can see the instruction itself in your compiled binary:
objdump -d --no-show-raw-insn raw_write | grep -B2 -A2 syscall
The instruction is right there:
    118b:	mov    -0x28(%rbp),%rdx
    118f:	syscall
    1191:	mov    %rax,-0x8(%rbp)
Three lines: load a register, execute one instruction, and store what came back. Everything else in this article happens between line two and line three.
The Crossing
When the CPU executes syscall, it does something no ordinary jump can do: it changes the privilege level of the processor. Your code runs in what x86 calls ring 3. Kernel code runs in ring 0.
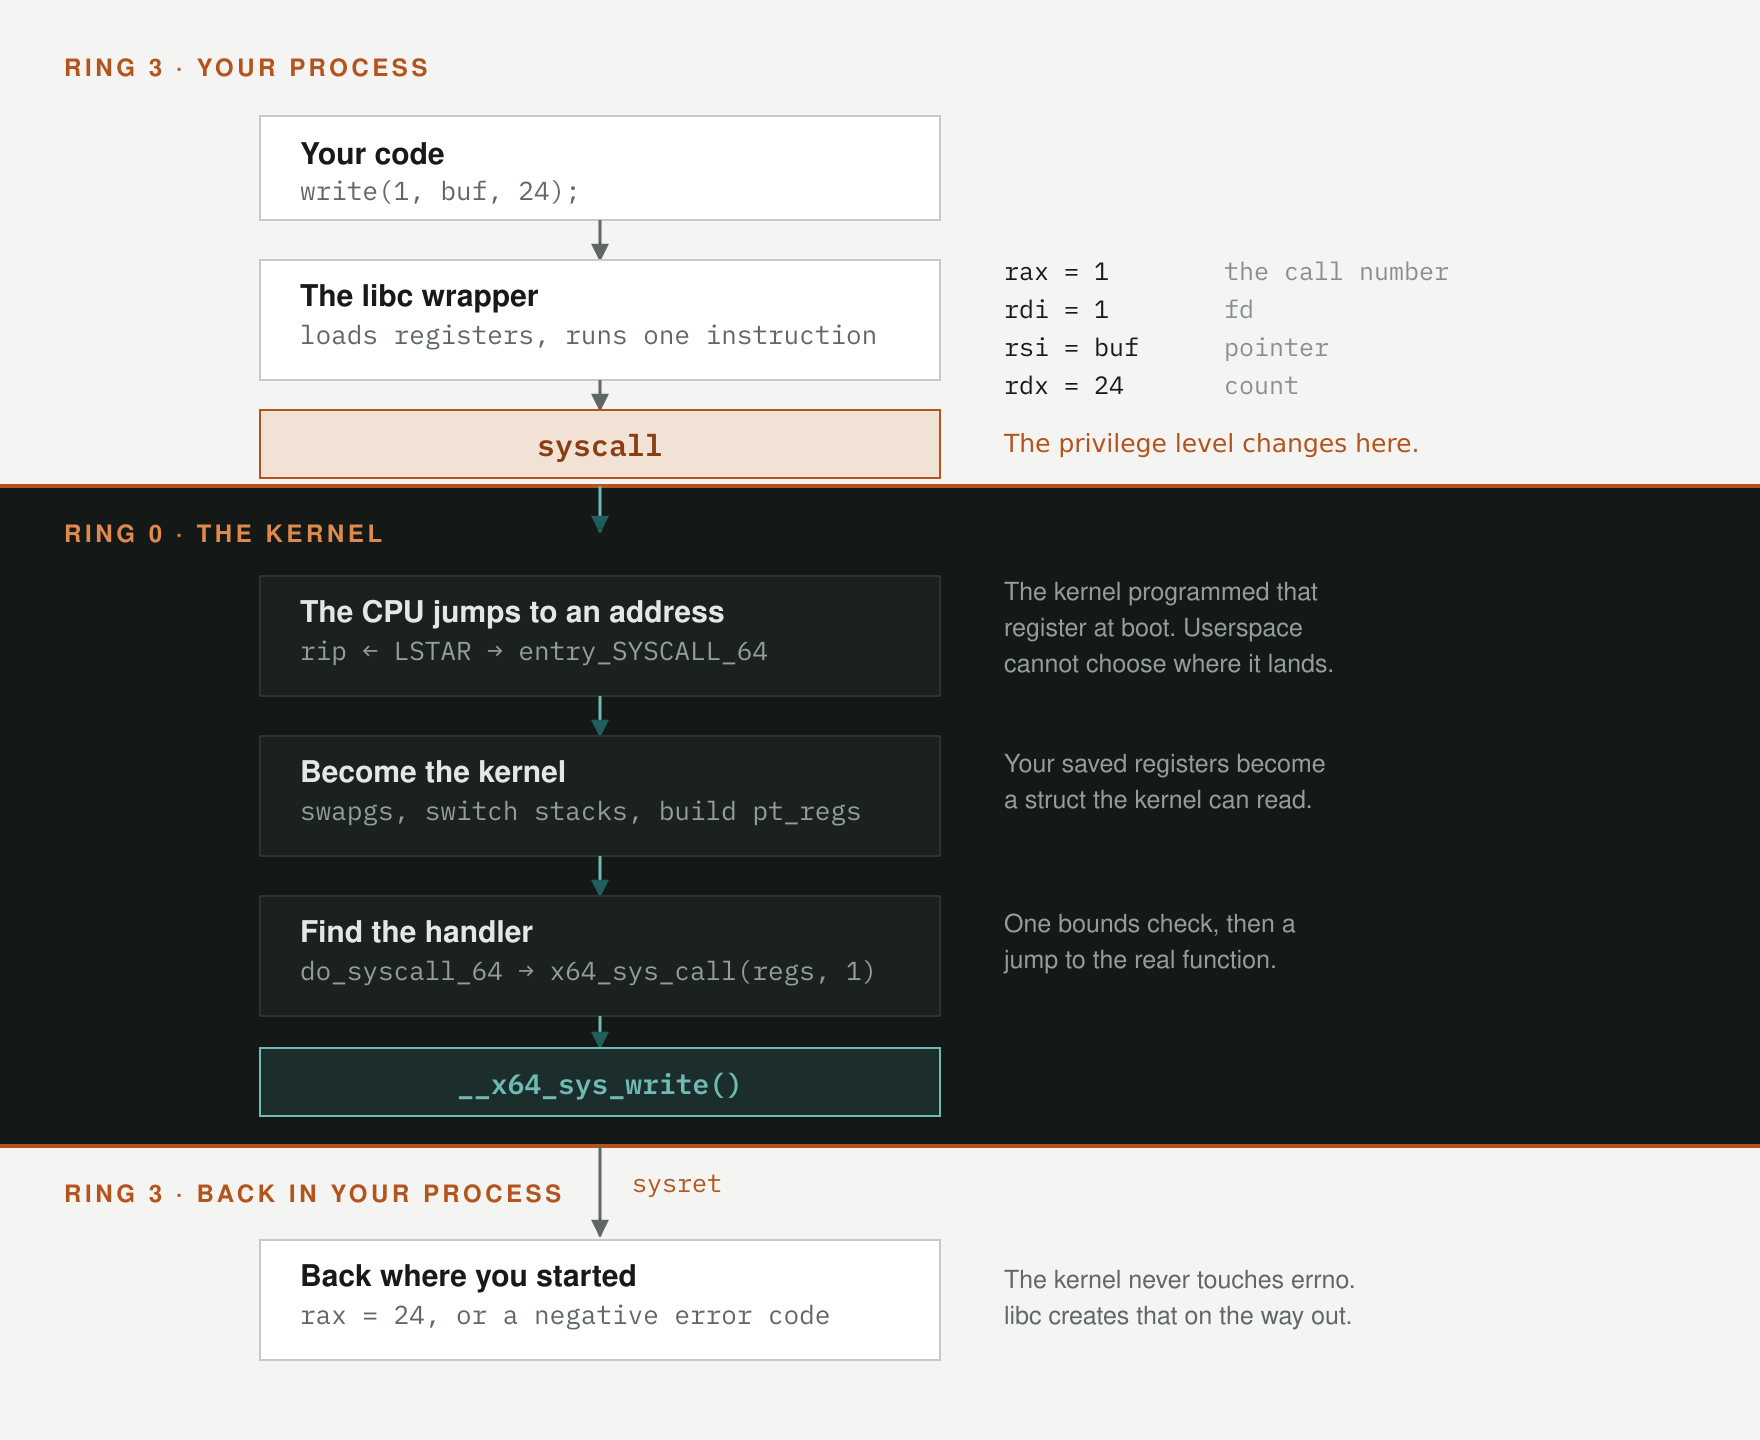
The instruction does three things, in order:
It saves the address of the next instruction in your program into
rcx. That's the return address, and it's whyrcxgets clobbered.It saves the CPU flags into
r11.It loads a new instruction pointer, code segment, and stack segment from three special CPU registers.
That third step is the important one. The new instruction pointer doesn't come from your program. It comes from a machine-specific register called LSTAR, and the kernel wrote that register during boot.
That's the security property the whole design rests on. Userspace triggers the transition. Userspace doesn't get to pick where it lands. There's one door, the kernel installed it, and it opens on entry_SYSCALL_64 in arch/x86/entry/entry_64.S.
Notice what the instruction does not do. It doesn't consult the interrupt descriptor table or push an exception frame. Older systems reached the kernel through int 0x80, a software interrupt with all of that machinery attached, and it was slow. The syscall instruction exists because this path was worth building dedicated hardware for.
Becoming the Kernel
Arriving at entry_SYSCALL_64 isn't the same as being ready to run kernel code. At the instant of arrival the CPU is in ring 0, but it's still using your stack and your register state. The kernel has to fix that before it can safely do anything.
Three things happen, and all three are the kernel establishing trust in a machine it is already running on:
1. swapgs
The kernel keeps a per-CPU pointer in the GS register so it can find its own data structures. While you were running, GS held whatever your program put there. A single instruction, swapgs, exchanges it for the kernel's value. The kernel documentation is unusually blunt about this one, calling it fragile and warning that it must nest perfectly. Get it wrong in either direction and you have a very bad afternoon ahead of you.
2. The stack switch
Your stack pointer is a value your program chose, so the kernel can't trust it. It stashes your rsp and switches to a kernel stack it allocated for this thread.
3. Building pt_regs
The kernel then pushes your saved registers onto that new stack in a specific order, forming a C struct called struct pt_regs. pt_regs is your process, frozen. Every debugger that inspects a stopped process, every signal handler that modifies the context it returns to, and every system call handler reads its arguments out of that struct.
There may be a fourth step. If your CPU is vulnerable to Meltdown, the kernel also swaps page tables here, because on those chips the kernel's memory can't safely stay mapped while your code runs.
That swap isn't free. It's why system calls got measurably slower in 2018, and why some of the numbers later in this article would look different on a machine three years older.
You can check whether your machine pays that cost:
cat /sys/devices/system/cpu/vulnerabilities/meltdown
The test machine here reports Not affected, because its generation of silicon has the fix in hardware. An older laptop will report Mitigation: PTI, and every system call it makes is doing extra work at exactly this point.
Look through the other files in that directory while you're there. Each one is a mitigation that this boundary may be paying for.
Inside the Kernel: Finding the Handler
The kernel is now running on its own stack with your registers safely captured. It calls a C function, do_syscall_64, and hands it two things: your pt_regs, and the system call number you left in rax.
Dispatch is short enough to describe completely. The kernel checks that your number is within range, clamps it, and jumps to the matching handler:
if (likely(nr < NR_syscalls)) {
    nr = array_index_nospec(nr, NR_syscalls);
    regs->ax = x64_sys_call(regs, nr);
}
Two things in there need explaining.
array_index_nospec is a Spectre mitigation. A plain bounds check isn't enough on a speculating CPU, because the processor may run ahead and touch memory past the end of the table before the check resolves. This helper forces the index to be clamped in a way speculation can't skip.
x64_sys_call is where a lot of older explanations are now wrong, including some still near the top of search results. They'll tell you the kernel indexes an array of function pointers called sys_call_table. That was true for many years and is no longer how dispatch works. Since kernel 6.9, x64_sys_call is a generated switch statement of direct calls.
The reason is a chain of consequences. Spectre mitigations made indirect calls through function pointers expensive, because each one has to go through a retpoline.
A switch of direct calls avoids that cost entirely. The table still exists, because tracing tools use it, but the hot path no longer reads it. On my 5.15 kernel the older table-based dispatch is still in place, which is exactly why naming your kernel version in an article like this one matters.
Where the Handler Comes From
The handler for write is named __x64_sys_write, and you won't find that name written anywhere in the kernel source. It's generated by a macro:
SYSCALL_DEFINE3(write, unsigned int, fd, const char __user *, buf, size_t, count)
SYSCALL_DEFINE3 means "a system call taking three arguments". The macro expands into two functions: the real implementation, and a thin wrapper named __x64_sys_write that takes a single struct pt_regs * and pulls the arguments out of it.
That indirection is deliberate. Rather than trusting whatever userspace happened to leave in the argument registers, the kernel unpacks exactly the values it expects from the frozen struct it built itself. It's the same defensive instinct as array_index_nospec, applied to the shape of the function call.
You don't have to take any of this on faith. ftrace, the kernel's built-in tracer, will show you the handler running.
This needs a root shell rather than sudo on each line, because the filter that keeps the output readable refers to the shell's own process ID:
sudo -i
cd /sys/kernel/tracing

echo 0 > tracing_on
echo $$ > set_ftrace_pid              # trace only this shell
echo function_graph > current_tracer
echo __x64_sys_write > set_graph_function

echo 1 > tracing_on
echo "trigger a write" > /dev/null    # the call we want to catch
echo 0 > tracing_on

head -40 trace
Without that set_ftrace_pid line, you'll trace every write on the machine, which on a running desktop is far too much output to read.
Here's the result on the test system, lightly trimmed:
 9)               |  __x64_sys_write() {
 9)               |    ksys_write() {
 9)               |      __fdget_pos() {
 9)   0.124 us    |        __fget_light();
 9)   0.363 us    |      }
 9)               |      vfs_write() {
 9)               |        rw_verify_area() {
 9)               |          security_file_permission() {
 9)               |            apparmor_file_permission() {
 9)   0.264 us    |              aa_file_perm();
 9)   0.457 us    |            }
 9)   0.644 us    |          }
 9)   0.857 us    |        }
 9)   0.083 us    |        write_null();
 9)               |        __fsnotify_parent() {
 9)   0.107 us    |          fsnotify();
 9)   1.383 us    |        }
 9)   2.813 us    |      }
 9)   3.449 us    |    }
 9)   3.720 us    |  }
Read that from the outside in and you have the whole descent in twenty lines.
__x64_sys_write is the generated wrapper. It calls ksys_write, the real implementation. That looks up your file descriptor with __fdget_pos, then hands off to vfs_write, the virtual filesystem layer, which is where the kernel stops caring what kind of thing you're writing to.
Then security_file_permission calls into AppArmor, because this machine runs Ubuntu. On a SELinux system something else sits there. Either way it's a security module deciding whether you're allowed to do this. On every write. Every one.
write_null is the payoff, and it's there by accident: the command above wrote to /dev/null, so that's the actual driver, the one whose whole job is throwing your bytes away. Point the same write at a file on disk and a filesystem function shows up in that slot instead. Nothing above it moves.
The whole thing took 3.7 microseconds, and the timings on the right tell you where it went.
When you're done, put the tracer back:
echo nop > current_tracer
echo > set_graph_function
echo > set_ftrace_pid
If /sys/kernel/tracing doesn't exist on your system, try /sys/kernel/debug/tracing instead.
The Return Trip, and the Truth About errno
The handler finishes and returns a number. That number goes into rax, and rax is the only thing your program gets back.
Which raises a question that is rarely asked directly: if the kernel can only return one value, how does it report what went wrong as well as that something went wrong?
The answer is that it doesn't have a separate channel. The kernel returns errors as small negative numbers in the same register as the result. A successful write of 24 bytes returns 24. A write to a closed descriptor returns -9, because EBADF is error number 9.
Now put that together with the fact that errno exists, and something doesn't add up. errno is a variable in your process. The kernel doesn't write to your variables.
Here's the test. Set errno to zero, make a raw system call that's guaranteed to fail, and look at both values:
#include <stdio.h>         /* fprintf, stderr */
#include <errno.h>         /* errno */

/* raw_write() is the function from the previous section */

errno = 0;

long ok  = raw_write(1, "written via raw syscall\n", 24);
long bad = raw_write(999, "x", 1);          /* not an open descriptor */

fprintf(stderr, "ok = %ld\n",  ok);
fprintf(stderr, "bad = %ld\n", bad);
fprintf(stderr, "errno = %d\n", errno);
Running it:
written via raw syscall
ok = 24
bad = -9
errno = 0
There it is. The kernel returned -9, and errno never moved.
errno is a libc invention. When you call the normal write(), the wrapper checks whether the return value is a small negative number. If it is, it negates it, stores the result in errno, and returns -1 to you. The -1-and-check-errno pattern every C programmer learns is a convention built entirely in userspace, on top of a kernel interface that works a completely different way.
Once you've seen this, a familiar bug class makes more sense. errno is only meaningful immediately after a failed call, because it's just a variable that the last wrapper to fail happened to write to.
Two Ways Out
Getting back to userspace has a fast path and a slow path.
The fast path is sysret, the mirror of syscall: it restores your instruction pointer from rcx and your flags from r11 and drops back to ring 3 in a few cycles.
The slow path is iret, the general-purpose return-from-interrupt instruction. It's significantly slower, and the kernel uses it when sysret can't be trusted. The entry code's own comments explain why: sysret has trouble with non-canonical addresses due to bugs in both AMD and Intel CPUs, so whenever something might have changed your saved state, the kernel forces the safe path. A debugger reaching in through ptrace and changing your registers is the usual culprit.
Before either instruction runs, the kernel does the housekeeping it deferred. It checks for pending signals and delivers them. It checks whether the scheduler wants the CPU back, and if so, your process stops here and something else runs.
Which means a system call isn't only a request for service. It's one of the main places your process can simply stop running. You asked to write five bytes. On the way back the kernel gets to reconsider everything about you, including whether you should continue at all.
The System Call That Never Happens
Now back to the mystery from the opening.
Look at your own process's memory map:
cat /proc/self/maps | tail -4
which ends with:
7fff32f97000-7fff32f9b000 r--p  [vvar]
7fff32f9b000-7fff32f9d000 r-xp  [vdso]
Two regions you never asked for. Neither came from your program or your libraries. The kernel put them there, in every process on the system.
[vdso] stands for virtual dynamic shared object. It's a small, complete shared library (real ELF, with a symbol table) that the kernel maps into every address space. And because the kernel tells each process where it put it, you can dump your own copy and take it apart:
#include <stdio.h>
#include <sys/auxv.h>      /* getauxval, AT_SYSINFO_EHDR */
#include <unistd.h>        /* getpagesize */

int main(void)
{
    void  *vdso = (void *)getauxval(AT_SYSINFO_EHDR);   /* the kernel tells us where */
    size_t len  = 2 * getpagesize();                    /* the mapping is two pages  */

    FILE *f = fopen("vdso.so", "wb");
    fwrite(vdso, 1, len, f);
    fclose(f);

    printf("vDSO was mapped at %p\n", vdso);
    return 0;
}
AT_SYSINFO_EHDR lives in <sys/auxv.h>. Leave that header out and you don't get a polite warning about it: the build stops with AT_SYSINFO_EHDR undeclared.
Run that, then read its symbol table like any other library:
./dump_vdso && objdump -T vdso.so | grep __vdso
and out comes:
__vdso_gettimeofday
__vdso_clock_gettime
__vdso_clock_getres
__vdso_time
__vdso_getcpu
There's the answer. clock_gettime is in that list.
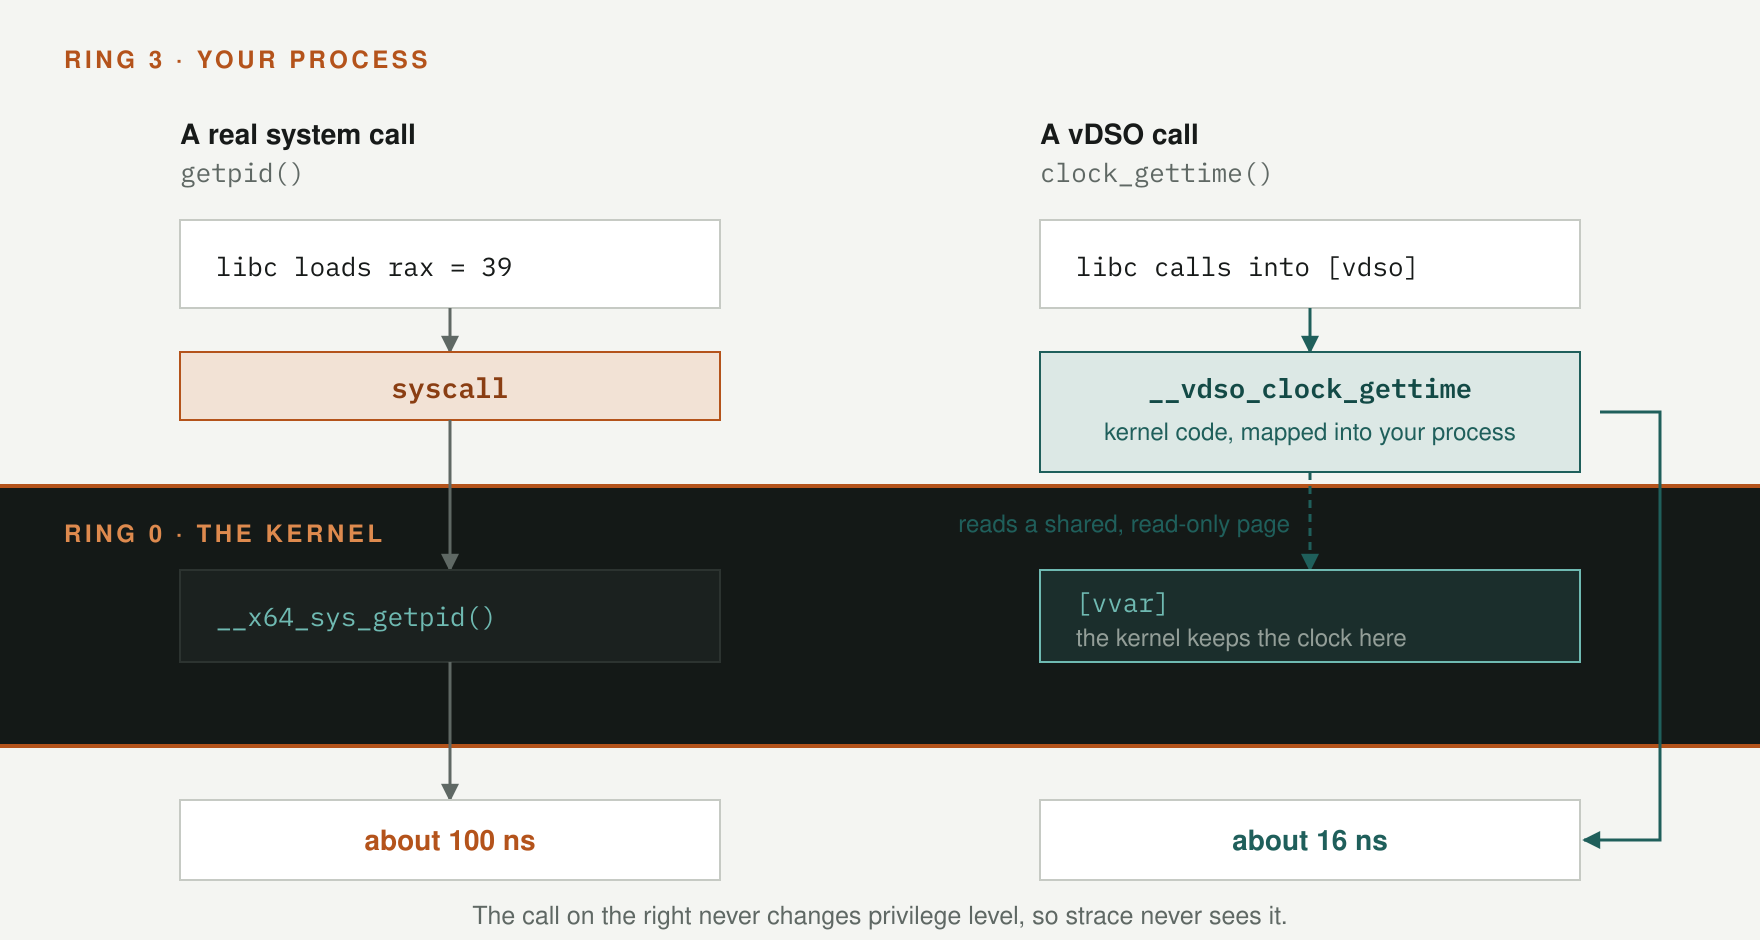
When you call clock_gettime(), libc calls into the vDSO. That code is written by kernel developers and shipped with the kernel, but it executes in ring 3, as part of your process. It reads the current time out of the [vvar] page (a read-only page the kernel keeps updated) and returns.
There's no privilege change, syscall instruction, entry point, stack switch, or pt_regs. And that means there's nothing for strace to see, because strace works by watching the boundary, and this call never goes near it.
That's the whole trick. The kernel took a handful of operations that are called constantly, need no privileges to read, and only ever return information the kernel is willing to publish – and it published them.
That last constraint explains why the list is so short. write() can never work this way, because it has to change state that belongs to the kernel. Reading the clock does not. So the clock, the time of day, and the current CPU number moved out to where the caller already is.
What the Boundary Costs
Everything above is mechanism. Here's the price, measured.
The benchmark compares a call that definitely traps against one that definitely does not. For the first, use syscall(SYS_getpid). Going through the thin syscall() wrapper guarantees a real crossing:
/* Excerpt. Needs <unistd.h>, <sys/syscall.h> and <time.h>, plus a now()
   helper returning seconds as a double, and ITERATIONS defined above. */

double a = now();
for (long i = 0; i < ITERATIONS; i++)
    sink += syscall(SYS_getpid);

double b = now();
for (long i = 0; i < ITERATIONS; i++)
    clock_gettime(CLOCK_MONOTONIC, &ts);
On the test machine, two million iterations of each:
real system call (getpid):   106.9 ns/call
vDSO call (clock_gettime):    17.2 ns/call
ratio:                          6.2x
Roughly six times, and getpid is about as cheap as a system call gets. It reads one field and returns. Which means almost none of that 107 nanoseconds is the work. It's the privilege change, swapgs, the stack switch, pt_regs going up and coming back down, plus whatever mitigations your particular CPU insists on along the way.
Now the caveat, because it matters more than the number.
That 107 nanoseconds is close to a best case. Check what this machine reported earlier: Not affected for Meltdown, so it never does the page-table swap. Its Spectre mitigation is Enhanced IBRS, which is handled in silicon rather than by retpolines in software. This CPU is skipping two of the most expensive things a crossing can involve.
So run the benchmark yourself, and read your own mitigation files alongside it:
grep . /sys/devices/system/cpu/vulnerabilities/*
If yours says Mitigation: PTI, your crossings are doing strictly more work than the ones measured here, and your number should be higher. Older silicon can be dramatically worse.
Treat the ratio as the durable result and the absolute number as one reading from one machine. The figure moves with your CPU, your kernel, and whichever mitigations you happen to be carrying. Run it a few times while you're there. The spread between runs on this laptop was about fifteen percent, which tells you roughly how much to trust any single number, including mine.
One more result from the same run corrects a widely repeated claim. getpid() through normal libc costs the same as the raw syscall(SYS_getpid). glibc used to cache the process ID to avoid the trip, and stopped years ago, because keeping the cache correct across fork and namespace changes was worse than paying the hundred nanoseconds.
Six times sounds abstract until you attach it to something. A program making a million small read() calls spends about a tenth of a second on nothing but crossings. This is the pressure behind a lot of modern kernel interface design: io_uring exists so that submitting a thousand operations can cost one crossing instead of a thousand. Batching syscalls, buffering writes, and using sendfile() instead of a read-write loop are all the same optimisation: not doing less work, just crossing the boundary fewer times.
Conclusion
You can now follow a system call the whole way. You've seen the syscall instruction in your own binary, watched a bad file descriptor come back as -9 while errno stayed at zero, pulled the vDSO out of your own address space and read its symbol table, and measured what the crossing costs on your own CPU.
More usefully, you have a mental model that keeps paying out. When you read that io_uring reduces syscall overhead, you know exactly what overhead means. When a profile shows time in entry_SYSCALL_64, you know what that function does. When strace shows nothing, you know to check the vDSO before doubting the tool.
There are a few directions to go from here. Run the ftrace recipe and follow __x64_sys_write down into the filesystem layer. Read arch/x86/entry/entry_64.S: it's heavily commented and much more approachable than its reputation suggests. Or check /sys/devices/system/cpu/vulnerabilities/ on an older machine and work out what each mitigation is costing you at this boundary.
Epilogue
I'm currently experimenting with an OS design on top of the Linux kernel that would bring an Android-style permissions and capabilities model to a desktop OS while trying to be 100% compatible with the Debian ecosystem. This has led to some really interesting research lately. This article is a product of that research.
I'll be writing more about the Linux kernel before I move on to formal verification, as in the DO-178C and DO-333 world where avionics software has to qualify the tools that check it. Usually that means Viper, Why3, Z3 and friends.
In the meantime, I also write about systems that have to survive contact with reality at thechris.in, including a companion piece to this one, on what it means to build on an abstraction whose cost you can measure but never see.